What Is CRO and Why Does It Matter?
Conversion Rate Optimization (CRO) is the disciplined practice of testing and improving the actions users take on your store. Buy a product. Sign up for email. Schedule a demo. Share a review.
Most merchants obsess over driving more traffic. CRO obsesses over converting the traffic you already have.
Here's the math: if you get 10,000 monthly visitors and a 1% conversion rate, you're selling 100 units/month. If you improve to 1.5%, suddenly you're selling 150 units—a 50% revenue increase with zero additional traffic spend.
This is why CRO is the leverage play for profitable growth. Doubling traffic costs 2x the ad spend. Improving conversion by 50% costs testing time and sometimes app fees ($99-$300/month). The ROI math favors CRO every time.
The Shopify CRO Funnel (4 Critical Stages)
Every Shopify store has a predictable funnel:
Traffic (Homepage)
    ↓
Product Discovery (Collection/Search)
    ↓
Product Decision (Product Page)
    ↓
Checkout (Cart → Payment → Confirmation)
Optimize each stage independently. Start with the bottleneck—the stage with the worst conversion rate.
Stage 1: Homepage Conversion (Homepage → Product Page)
The metric: % of homepage visitors who click to a product page
Benchmarks: - Weak stores: 5-8% - Average: 15-20% - High-converting: 25%+
How to diagnose the leak:
- Go to Google Analytics 4 → Behavior → Pages and Screens
- Filter for
/(homepage only) - Look at "Engaged Sessions Rate" (bounce rate proxy)
- If <40%, your homepage isn't compelling. Users leave immediately.
Optimization tactics:
- Hero headline: Change from "Welcome" to benefit-focused ("Save 20% on premium sneakers")
- CTA clarity: 1 primary button, not 5 competing CTAs
- Product showcase: Show 3-4 hero products, not random 20
- Social proof: Add "4.8★ from 2,000+ customers" above the fold
- Load time: Compress hero image to <200KB
Test to run: Change hero headline from "New Collection" to "Premium [Your Product] Made in USA" → expect 8-15% lift in CTR
Stage 2: Collection/Search Conversion (Discovery → Product Page Click)
The metric: % of collection/search visitors who click a product
Benchmarks: - Weak: 8-12% - Average: 20-28% - Strong: 35%+
How to diagnose:
- Analytics → Pages → Filter
/collections/and/search/ - Compare "Click-through rate" for product links
- If <20%, your product cards aren't compelling
Optimization tactics:
- Product images: Use lifestyle photos, not studio shots. Humans buy aspirations, not specs.
- Product titles: Be specific ("Wool Blend Joggers" not "Pants")
- Price display: Show $ first—it attracts price-conscious shoppers. Hide it second for premium play.
- Badges: "On Sale," "New," "Best Seller" increase CTR by 15-25%
- Sorting: Make "Best Sellers" and "New" default sorts
- Pagination: Use "Load More" instead of pagination (scroll is easier than click)
Test to run: Add "Best Seller" badge to top 10 products → expect 12-18% lift in CTR
Link strategy: Link related Shopify collection pages internally to boost discovery.
Stage 3: Product Page Conversion (View → Add to Cart)
The metric: % of product page visitors who add to cart
Benchmarks: - Weak: 2-4% - Average: 6-10% - Strong: 15%+
How to diagnose:
- Analytics → Events → "add_to_cart" event
- Cross-reference with product page views
- Calculate: (add_to_cart events) / (product page views) = conversion %
- If <6%, your product page has friction
Optimization tactics:
- Product image gallery: 4-6 angles minimum. Video showing product in use lifts conversion 20-30%
- Price anchoring: Show original price crossed out if on sale ("Was $99, Now $59")
- Availability: Show stock count ("Only 3 left!") or "In Stock" badge
- Shipping info: Show free shipping or estimated delivery time above the fold
- Size/color options: Make variants easy to select—don't hide them
- Reviews: Show 3-5 recent reviews with photos (not average rating alone)
- Urgency: Limited-time discount (not countdown timer—they hurt trust)
- FAQ: Answer top 5 objections: "Is it in stock?" "How long does shipping take?" "What if it doesn't fit?"
Test to run: Add customer photo gallery + review snippets → expect 10-15% lift in ATC
Stage 4: Checkout Conversion (Cart → Payment → Confirmation)
The metric: % of add-to-cart users who complete purchase
Benchmarks: - Weak: 50-60% (lose 40% in checkout) - Average: 65-75% (lose 25-35%) - Strong: 80%+ (lose <20%)
How to diagnose:
- Analytics → Funnel Analysis: Create funnel = View Item → Add to Cart → Begin Checkout → Purchase
- Note where you lose the most users
- Most stores lose 25-40% of cart visitors. That's your optimization target.
Optimization tactics:
Guest checkout: Let users buy without account creation. 3-5% lift.
Shipping clarity: Show shipping options and costs on first page, not after checkout start. Unexpected shipping costs are the #1 abandonment trigger.
Payment options: Offer multiple: Credit card, PayPal, Apple Pay, Google Pay. Each option is 2-4% incremental conversion.
Form fields: Required fields only. Phone number? Optional. Shipping notes? Optional. First/last name? Required.
Promo code field: Keep it visible. 8-12% of users have a code. Hidden promo fields lose revenue.
Progress indicator: Show "Step 1 of 3" or "Shipping → Payment → Confirm." Reduces abandonment by 5-8% (users know how long checkout takes).
Error messaging: Clear, not angry. "Enter valid email" not "INVALID INPUT."
Confirmation page: Show order number + estimated delivery date. Reduces support tickets by 20-30%.
Test to run: Add payment icons (Apple Pay, PayPal) above the fold → expect 3-6% lift in completion rate
The Testing Framework: Multivariate Testing
A/B testing changes one variable. Multivariate testing (MVT) tests combinations.
Simple MVT example:
| Headline | Image | CTA Text | Conversion |
|---|---|---|---|
| "Save 20%" | Before | "Shop Now" | 2.1% |
| "Save 20%" | Lifestyle | "Shop Now" | 3.8% |
| "Premium Quality" | Lifestyle | "Learn More" | 2.9% |
| "Premium Quality" | Lifestyle | "Shop Now" | 4.2% |
Winner: "Premium Quality" + Lifestyle image + "Shop Now" = 4.2% (2x baseline)
Tools for MVT on Shopify: - Shopify Experiments (built-in, free) - Convert Kit ($99/month, Shopify-native) - Unbounce ($99-$299/month, landing pages) - Optimizely (enterprise, $300+/month)
For DTC brands under $1M revenue, Shopify Experiments is sufficient. It runs server-side tests (no JavaScript overhead) and integrates with GA4 natively.
How to Set Up MVT in Shopify Experiments
- Go to Settings → Apps and Integrations → Experiments
- Create new experiment: "Product Page CTA Test"
- Select variant: 50% traffic to control, 50% to variant
- Test duration: 2-4 weeks (minimum 1,000 visitors per variant)
- Monitor daily results in GA4 dashboard
- Don't stop test early (statistical significance requires 2-4 weeks)
- Winner declared: p-value <0.05 (95% confidence)
- Roll out winner to 100% of traffic
Critical rule: One test at a time. Multiple concurrent tests muddy the data.
The Testing Roadmap (6-Month Plan)
Run these tests in order (each 2-4 weeks):
Month 1: - Test 1: Homepage hero headline (benefit-focused vs current) - Test 2: Product page image gallery (5+ images vs 3)
Month 2: - Test 3: Checkout CTA button color (blue vs green) - Test 4: Shipping info placement (above vs below cart total)
Month 3: - Test 5: Product reviews display (photo reviews vs text-only) - Test 6: Cart page urgency messaging (stock count vs none)
Month 4: - Test 7: Payment options visibility (icons above form vs below) - Test 8: Email signup incentive ("Subscribe" vs "Get 15% Off")
Month 5: - Test 9: Collection page sorting default (Best Sellers vs Newest) - Test 10: Product badges ("On Sale" vs "Limited Quantity")
Month 6: - Test 11: FAQ section placement (product page mid-section vs bottom) - Test 12: Testimonial format (video vs text)
Expected cumulative lift: 15-40% conversion increase (compounded effects)
The CRO Diagnostics Checklist
Run this audit quarterly:
| Area | Question | If No → Priority |
|---|---|---|
| Funnel | Do you know your conversion rate at each stage? | Set up GA4 events |
| Homepage | Is hero headline benefit-focused? | Rewrite it |
| Collection | Do product cards show lifestyle images? | Update images |
| Product page | Do you show reviews with photos? | Add review app |
| Checkout | Do you offer 3+ payment methods? | Add PayPal, Apple Pay |
| Shipping | Is shipping cost shown before checkout? | Show in cart |
| Mobile | Is checkout optimized for mobile (44px buttons)? | Test on iPhone |
| Speed | Is homepage <3 seconds on 4G? | Compress images |
| Testing | Do you run experiments monthly? | Set test calendar |
Common CRO Mistakes (What Kills Conversion)
Mistake 1: Testing too many things at once Multiple concurrent tests interact. You can't isolate causes. Run one test per 2-4 weeks.
Mistake 2: Stopping tests early "We see a 2% lift after one week—ship it!" Not statistically significant. Minimum 2-4 weeks (1,000+ visitors per variant).
Mistake 3: Optimizing for the wrong metric Testing average order value instead of conversion rate. AOV tests take 3x longer (fewer transactions to measure). Start with conversion rate (faster data).
Mistake 4: Not tracking mobile separately Mobile conversion is 40-60% lower than desktop. Optimize mobile specifically—don't apply desktop wins to mobile.
Mistake 5: Fake urgency (countdown timers) Users distrust countdown timers. Use real urgency ("Shipping cut-off in 2 hours") instead.
Mistake 6: Too many form fields Each field loses 5% of users. If you need email, phone, address, and company—that's 4 fields = 20% abandonment. Reduce to 2-3 fields max.
Advanced CRO: Personalization and Segmentation
Once you've optimized the baseline, personalize by segment:
By traffic source: - Email traffic → show "For Subscribers" banner - Paid ad traffic → show discount matching their ad offer - Organic traffic → show social proof (reviews, testimonials)
By device: - Mobile → hide non-essential fields, make CTA sticky - Desktop → show full feature list, bigger hero image
By return visitor: - First-time visitors → show brand story, trust badges - Returning customers → show personalized recommendations, loyalty discount
By cart value: - Low cart (<$50) → show free shipping threshold - High cart (>$150) → show "Buy more save more" upsell
Tools: Klaviyo (email), Octane AI (SMS), or Shopify's native recommendation engine.
Key Takeaway
CRO is systematic. You diagnose a leaky funnel, test improvements, and compound gains over 6-12 months. A 2% monthly conversion lift compounds to 26% annual improvement.
The merchants winning aren't smarter. They're disciplined. They test monthly, measure rigorously, and ship only winners.
Start with this week: pull your GA4 conversion funnel. Identify your worst-converting stage. Run one test targeting that stage. Repeat monthly.
Six months from now, you'll have 15-25% higher revenue from the same traffic. That's the CRO flywheel.
FAQ
Q: How long does it take to see CRO results? A: 6-12 months for 20%+ lift. Each test is 2-4 weeks. You need 6-8 tests to see compounded gains.
Q: What's the minimum traffic needed for testing? A: 1,000 visitors per variant per test (2,000 total). Below that, results are statistically unreliable.
Q: Should I hire a CRO agency or do it in-house? A: If you have 10,000+ monthly visitors, hire an agency ($2K-$10K/month). Below that, DIY testing with Shopify Experiments.
Q: Do I need an analytics tool beyond Google Analytics? A: GA4 is sufficient for most tests. For advanced segmentation, add Heap (heatmaps) or Hotjar ($50/month).
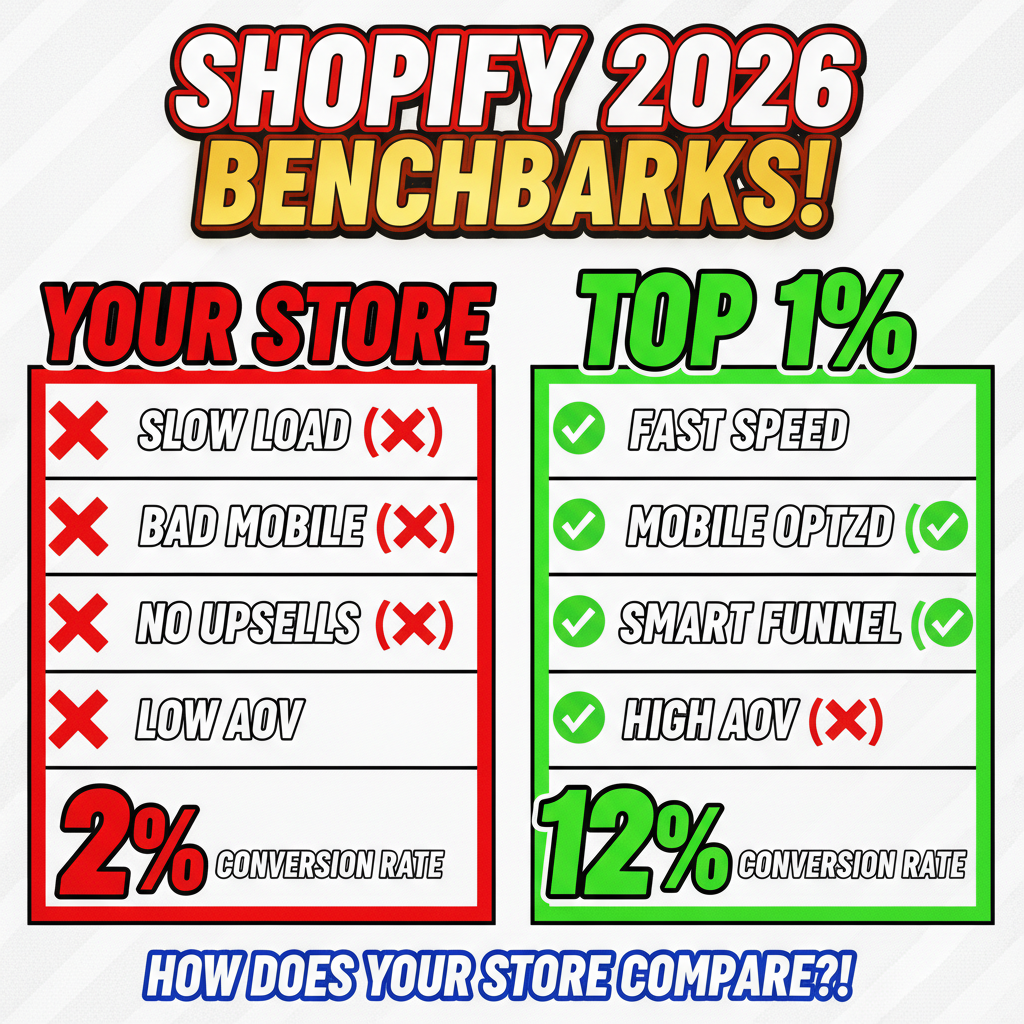
Q: What's a realistic conversion rate for Shopify stores? A: E-commerce average is 2-3%. Top 25% of stores hit 3-5%. Luxury/premium brands: 1-2% (higher AOV). Fast-moving goods: 5-8%.
Q: Can I run CRO without changing my theme? A: Yes. Shopify Experiments work on any theme. Most tests change copy, buttons, or image order—not design.
Ready to optimize your store? Start with multivariate testing on your product page. Test headline + image combo for 4 weeks. Measure. Ship the winner.
The 15-40% conversion lift isn't theory—it's achievable with discipline and data.
For a custom CRO strategy tailored to your store's metrics, Tenten's optimization team can audit your funnel and recommend tests that match your business model. We've helped 100+ Shopify stores improve conversion by 18-32% annually.
Resources
- Shopify Experiments Documentation: https://shopify.dev/docs/apps/selling-strategies/experimentation
- Google Analytics 4 Guide: https://support.google.com/analytics
- Dynamic Pricing Strategies for optimization
- Baymard Institute (CRO research): https://baymard.com/