Opening
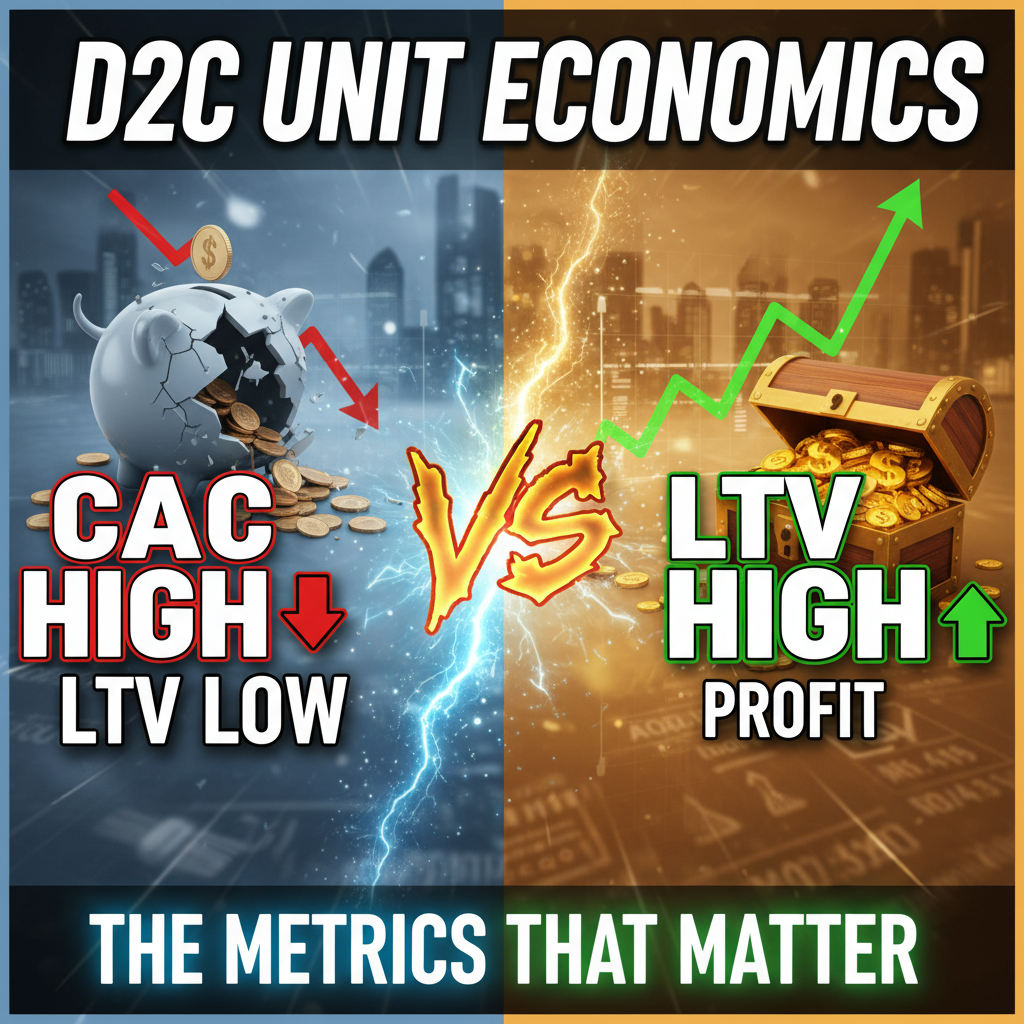
Unit economics separate surviving D2C brands from sustainable ones. If you don't know your customer acquisition cost (CAC), lifetime value (LTV), and the relationship between them, you're flying blind. This isn't theoretical finance—it's the operating system of a D2C business.
I've worked with 15+ DTC brands over the last three years. Nearly all of them misjudged their unit economics at first. Some thought they were profitable when they weren't. Others killed marketing channels that actually worked. The difference between getting this right and getting it wrong often comes down to a 2-3 point improvement in gross margin or a single percentage point in repeat purchase rate.
This guide covers the four metrics that matter most: CAC, LTV, CAC payback period, and LTV:CAC ratio. You'll also get benchmark tables so you can see how your unit economics compare to healthy D2C brands.
Why Unit Economics Matter Now
D2C competition has intensified. Customer acquisition costs rose 21% YoY from 2022 to 2024, according to Statista's DTC e-commerce report. At the same time, repeat purchase rates have flattened around 25-30% for most categories. This means your margin for error on first-purchase profitability has shrunk.
Two years ago, a breakeven first purchase was acceptable if LTV was strong. Today, you often need to turn a small profit on the first order to justify the spend. That's where unit economics math becomes your competitive advantage.
Part 1: The Four Core Metrics
Customer Acquisition Cost (CAC)
CAC is how much you spend to acquire one customer.
Formula: Total marketing spend / Number of new customers acquired
If you spent $50,000 on performance marketing last month and gained 1,000 new customers, your CAC is $50.
That sounds straightforward. But precision matters. Here's where founders slip:
Common mistake: Bundling all marketing spend. Some brands add salaries, software, and content creation into CAC. That inflates the number and makes channels look worse than they are. Instead, calculate CAC as direct spend only—ad spend, influencer partnerships, affiliate commissions, paid search.
What to track: CAC by channel. You might have a $35 CAC on TikTok Ads, a $52 CAC on Facebook, and a $28 CAC on Google Shopping. Knowing this breakdown tells you where to double down and where to cut.
Why it matters for D2C: Your CAC determines your payback threshold. If CAC is $50 and average order value is $60, you're breaking even on day one only if you hit 83% gross margin. Most D2C brands sit at 55-70% gross margin. So a $50 CAC with $60 AOV and 65% margin nets $39, giving you a small first-purchase profit. That's the tightrope D2C founders walk.
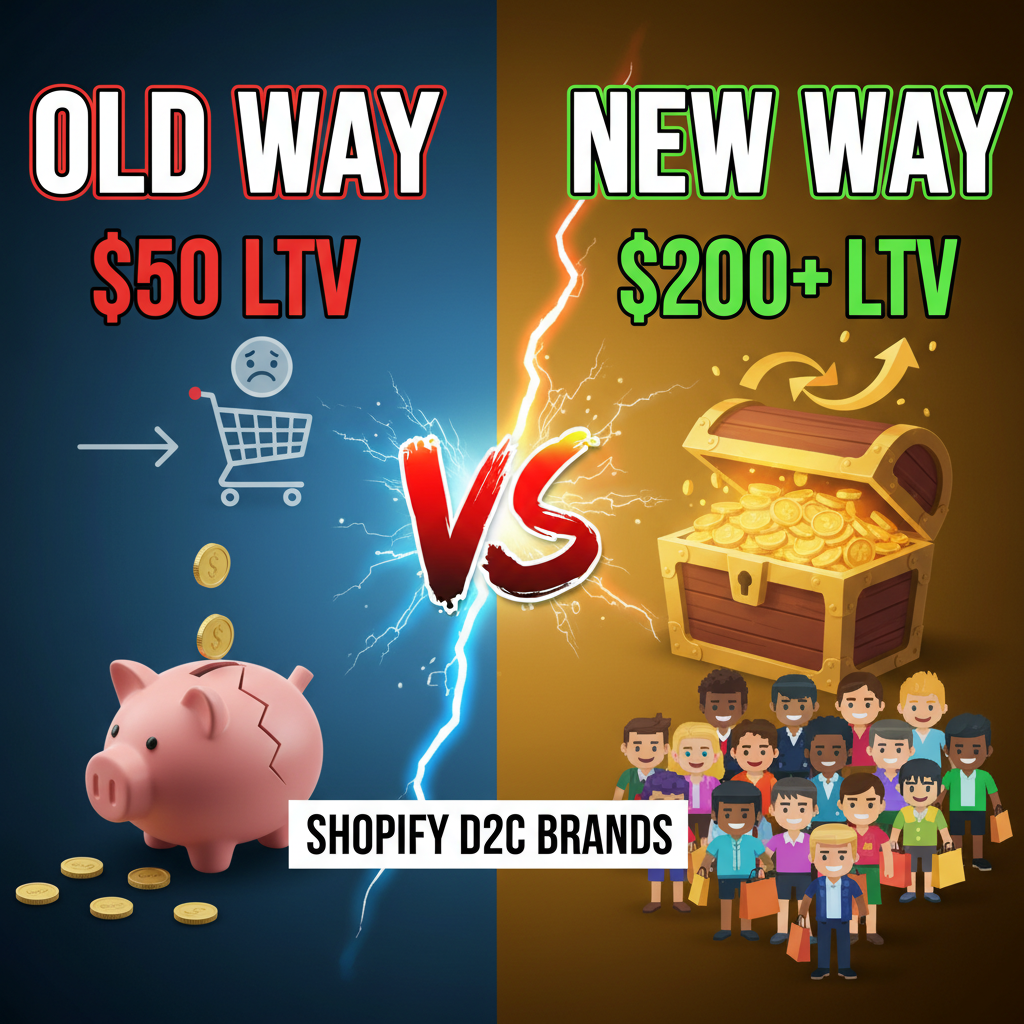
Lifetime Value (LTV)
LTV is the total profit you'll make from a customer across their entire relationship with your brand.
Formula: (Average order value × Gross margin %) × Average number of purchases per customer × Average customer lifespan (in years)
Example: A brand has a $75 average order value, 62% gross margin, customers make 2.4 purchases per year, and stay active for 3 years.
LTV = ($75 × 0.62) × 2.4 × 3 = $333
What founders miss: LTV assumes repeat purchases, but repeat rate is often the weakest link. A brand with a $75 AOV and 68% margin but only a 18% repeat rate (0.18 orders per customer in year one) will have an LTV under $100. That's not sustainable against a $50 CAC.
Inputs you must nail: 1. Gross margin: Revenue minus cost of goods sold. Not revenue minus all operating costs. Many founders confuse this. Gross margin excludes rent, payroll, and software. 2. Repeat purchase rate: What percentage of customers buy a second time? Track this by cohort. A brand might have 22% repeat in month 1, 12% repeat in month 2, and 8% repeat in month 3. 3. Customer lifespan: How many years does the average customer stay active? For D2C apparel, 2-3 years is common. For vitamins or beauty, it can stretch to 4+ years.
CAC Payback Period
Payback period answers: How long until a customer's purchases pay back the acquisition cost?
Formula: CAC / (Average order value × Gross margin % × Repeat rate per month)
Example: CAC is $50, AOV is $75, gross margin is 62%, repeat rate is 25% per month.
Monthly profit per repeat customer = $75 × 0.62 × 0.25 = $11.63
Payback period = $50 / $11.63 = 4.3 months
Why this metric is critical: A 3-month payback means you reinvest your profit into growth fast. A 12-month payback means you're capital-constrained. Most healthy D2C brands hit 4-6 month payback.
LTV:CAC Ratio
This is the most important ratio in D2C. It tells you if your unit economics actually work.
Formula: LTV / CAC
Example: LTV is $400, CAC is $50. Ratio is 8:1.
What the ratios mean:
| Ratio | Interpretation | Action |
|---|---|---|
| 1:1 or below | Not sustainable. Customer lifetime profit equals or falls short of acquisition cost. | Stop all paid marketing. Fix repeat rate or lower CAC. |
| 2:1 | Breakeven on contribution margin. No room for error. | Viable short-term only. Growth is possible but risky. Improve margin or repeat rate. |
| 3:1 | Healthy baseline for venture-backed D2C. Most brands target this. | Sustainable path to profitability if you have 18+ months of runway. You can compound growth. |
| 4:1 to 5:1 | Strong unit economics. You have buffer for paid acquisition scaling. | Safe to increase CAC spend. Room to reinvest for growth. |
| 5:1 or higher | Elite D2C unit economics. Profitable growth is almost certain. | Scale aggressively. You can afford higher CAC channels. |
The 3:1 rule: VC-backed D2C founders often use 3:1 as the minimum acceptable ratio. Below that, unit economics are shaky. Above that, you can scale with confidence.
Part 2: Common Metrics Mistakes
Mistake 1: Ignoring Churn in LTV Calculation
Founders often assume customers stick around forever. In reality, D2C churn is brutal. Most brands lose 85-90% of their customers within the first year.
If you have a 25% repeat rate in month 1, most customers never buy again. Your true LTV is much lower than a "2.4 purchases per year for 3 years" projection.
Fix: Use cohort analysis. Track repeat rate month-by-month for each customer cohort. Build LTV from actual data, not assumptions.
Mistake 2: Including Non-Unit-Economics Overhead in CAC
Salaries, rent, software subscriptions, and accounting costs are operating expenses. They're not CAC.
Many founders lump these in when calculating unit economics and conclude every channel is "unprofitable." This leads them to kill channels that actually work.
Fix: Separate unit economics (CAC, LTV, payback) from operating expenses. Both matter, but they're different questions.
Mistake 3: Using Revenue Instead of Gross Profit in LTV
LTV must be profit, not revenue. If you calculate LTV as "$75 AOV × 2.4 purchases per year × 3 years = $540," you're ignoring COGS. Your actual profit is $75 × 0.62 margin × 2.4 × 3 = $333.
The difference is massive.
Fix: Always multiply AOV by gross margin percentage. Gross profit = AOV × (1 - COGS ratio).
Part 3: Benchmarks for Healthy D2C Unit Economics
Here's where your brand should stand:
| Metric | Benchmark Range | Healthy | At Risk |
|---|---|---|---|
| CAC | $25–$75 | $35–$50 | $75+ |
| LTV (year 1) | $120–$350 | $250–$350 | Under $120 |
| CAC Payback Period | 3–8 months | 4–6 months | 12+ months |
| LTV:CAC Ratio | 3:1 minimum | 4:1 to 5:1 | Below 2:1 |
| Gross Margin | 55–75% | 62–68% | Below 50% |
| Repeat Purchase Rate (month 1) | 15–35% | 22–30% | Below 15% |
| Customer Lifespan | 2–4 years | 2.5–3.5 years | Under 1.5 years |
These benchmarks are for direct-to-consumer brands selling physical products (apparel, beauty, food, supplements). Digital or SaaS-based D2C brands often have higher margins and repeat rates.
Part 4: How to Improve Unit Economics
Tactic 1: Reduce CAC Without Cutting Growth
Most brands think the only way to lower CAC is to spend less. Actually, it's often about spending smarter.
Three approaches:
-
Optimize channel mix. If TikTok Ads deliver $35 CAC and Google Shopping delivers $55 CAC, reallocate budget. A 30% shift toward TikTok might lower blended CAC by $4–$6.
-
Improve ad quality. Brands that A/B test creative see 15-25% CAC reductions within 90 days. Test hook variations, angles, and messaging against your current winners.
-
Use UTM-tagged analytics. Many brands don't know their true CAC by channel because they lump all traffic together. Implement proper UTM tracking. You may find that your "top performer" is actually a laggard once you exclude organic and direct.
Tactic 2: Increase LTV Through Repeat Rate
Repeat rate is the easiest lever to pull for LTV improvement. A 5-point increase (e.g., 25% to 30% repeat rate) can lift LTV by 15-25%.
Three ways:
-
Post-purchase email sequence. A brand selling $60 apparel items with a 22% repeat rate added a 5-email post-purchase sequence. Repeat rate climbed to 28%. That's a $20+ LTV improvement per customer.
-
Loyalty program. Most D2C brands see 2-4% repeat rate lift from loyalty. If you have 1,000 customers and a 2-point lift, that's 20 additional repeat purchases per month.
-
Product bundling and upsells. Offer complementary products on the post-purchase page. Brands see 12-18% attachment rate on upsells and a corresponding repeat rate boost.
Tactic 3: Improve Gross Margin
A 3-point margin improvement (e.g., 62% to 65%) lifts LTV by the same percentage.
Two primary levers:
-
Negotiate supplier costs. If you're doing $2M+ in annual revenue, you have bargaining power. A 3-5% supplier cost reduction isn't uncommon.
-
Reduce fulfillment and return costs. Some brands overspend on packaging or have high return rates. Audit your fulfillment partner's pricing and product quality.
Part 5: Unit Economics by Business Model
Unit economics vary by business model. Here's what healthy looks like for different D2C types:
Apparel & Fashion
- Typical CAC: $40–$65
- Typical LTV: $200–$400
- Typical Repeat Rate: 18-28%
- Typical Gross Margin: 60-70%
Apparel brands face high return rates and seasonal demand. Repeat is lower than average because customers replenish infrequently. Gross margin is solid because manufacturing at scale is efficient.
Beauty & Personal Care
- Typical CAC: $35–$55
- Typical LTV: $450–$700
- Typical Repeat Rate: 35-50%
- Typical Gross Margin: 65-75%
Beauty has the highest repeat rates because consumption is habitual. LTV is strong. Margins are high because formulation costs are low relative to retail price.
Supplements & Nutrition
- Typical CAC: $30–$50
- Typical LTV: $350–$600
- Typical Repeat Rate: 32-45%
- Typical Gross Margin: 70-80%
Supplements hit the sweet spot: habitual consumption, high margins, and strong repeat. These brands often achieve 4:1 or better LTV:CAC ratios.
Food & Beverage
- Typical CAC: $25–$45
- Typical LTV: $200–$350
- Typical Repeat Rate: 20-35%
- Typical Gross Margin: 50-65%
Food is margin-constrained by logistics and perishability. CAC is lower because CPM costs are often cheaper. Repeat varies wildly by product (coffee has higher repeat than snacks).
Part 6: Questions to Ask Your Team
If you don't know these answers, fix it before scaling:
-
What's your current CAC by channel? (Paid search, social, email, affiliate, organic.)
-
What's your repeat purchase rate by acquisition channel? Some channels deliver better repeat customers.
-
What's your gross margin after returns? Don't forget returns reduce effective margin.
-
How many customers do you retain past month 6? Most churn happens early. Track your cohort retention curve.
-
Is your LTV:CAC ratio above 3:1? If not, you need to fix unit economics before scaling paid media.
Part 7: Taking Action
Unit economics rarely stay static. Every time you change pricing, shipping, product quality, or marketing channels, unit economics shift.
Quarterly review checklist:
- Recalculate CAC by channel. Did it improve or worsen?
- Recalculate LTV using current repeat rate data. Any improvements?
- Compare payback period to three months ago. Is growth reinvestment getting faster?
- Check LTV:CAC ratio against your targets. Are you hitting 3:1 minimum?
If LTV:CAC is below 3:1, you have three paths: cut CAC, improve repeat rate, or increase margin. Pick one, run it for 60-90 days, and measure the impact.
Most importantly: Don't wait for unit economics to be perfect before you scale. Get to 3:1, then optimize incrementally. The brands that move fast and measure faster win.
Related Articles
For deeper dives, read our guides on D2C pricing strategies and scaling D2C on Shopify.
Article FAQ
FAQ 1: What's the difference between LTV and customer lifetime revenue?
Answer: Customer lifetime revenue (CLR) is the total gross revenue a customer generates. LTV is profit—revenue minus cost of goods sold. LTV is the metric that actually matters for unit economics because it accounts for the cost of making the product. If a customer generates $500 in revenue but $300 in COGS, LTV is $200, not $500.
FAQ 2: How often should I recalculate unit economics?
Answer: At minimum, quarterly. Many fast-growing brands calculate monthly because acquisition costs, repeat rates, and margins shift quickly. If you run seasonal campaigns or test new channels, calculate after each campaign ends.
FAQ 3: Should I include customer service costs in CAC or COGS?
Answer: Neither. Customer service is an operating expense. It's separate from unit economics. Unit economics focus on acquisition (CAC), product cost (COGS), and lifetime profit (LTV). Overhead like salaries, software, and support should be tracked separately.
FAQ 4: What if my repeat purchase rate varies dramatically by cohort?
Answer: It usually does. Older cohorts have higher repeat rates because you've had more time to upsell and retain them. Use a blended LTV based on your average customer lifespan (typically 2-3 years for D2C), not just year-one repeat rate. Or calculate LTV for year-one, year-two, and year-three separately.
FAQ 5: Can I improve LTV:CAC ratio by just cutting CAC?
Answer: Technically yes, but it's often a trap. The brands that sustain 5:1+ ratios do so by improving repeat rate and margin, not by cutting acquisition spend. Cutting CAC too aggressively often means you're selecting for less loyal customers or cheaper traffic that doesn't convert as well downstream.
Call to Action
Unit economics are the foundation of profitable D2C growth. If you're unsure how yours compare to industry benchmarks or how to optimize them, we can help. Schedule a brief consultation with our team to audit your D2C metrics and build a roadmap to 4:1+ LTV:CAC ratios. Or explore how Shopify Plus can support high-volume D2C operations.