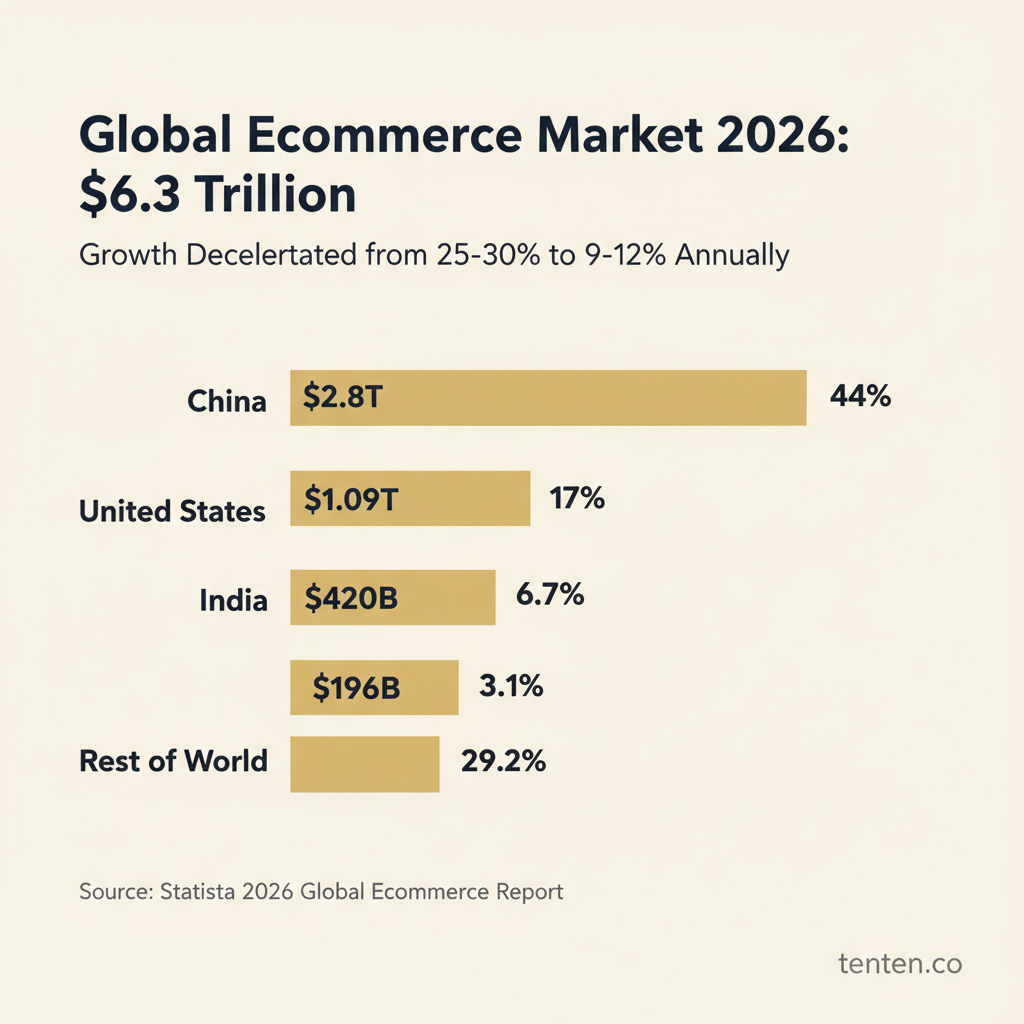
$6.3 Trillion and Slowing Down: What the 2026 Ecommerce Data Actually Tells Us
Global ecommerce hit $6.3 trillion in 2025 — up 11.2% from 2024 (Statista). The US captured $1.09 trillion. China still leads at $2.8 trillion (44% of global volume). India is now the third-largest market at $420 billion after 38% year-over-year growth.
But here's what the headline number obscures: growth has decelerated hard. From 2018–2021, ecommerce grew 25–30% annually. Now it's 9–12%. The low-hanging fruit is gone. The merchants winning today aren't the ones with the best products — they're the ones with the best unit economics, the strongest retention loops, and the most ruthless margin discipline.
This isn't a 2026 trends listicle. This is an operator's field guide — data-backed, opinionated, and built for merchants who need to make budget decisions this quarter.
| Region | 2025 Revenue | YoY Growth | Global Share |
|---|---|---|---|
| China | $2.8T | 8.5% | 44% |
| United States | $1.09T | 9.8% | 17% |
| India | $420B | 38% | 6.7% |
| UK | $196B | 7.2% | 3.1% |
| Rest of World | $1.83T | 12.4% | 29.2% |
AI Commerce Is No Longer Optional — It's Infrastructure
AI-powered shopping assistants moved from "nice-to-have" to table stakes in 2025. The adoption rate among US ecommerce merchants hit 34% (up from 18% in 2024). By end of 2026, that number reaches 60% — meaning merchants still running non-AI storefronts are actively losing ground.
The ROI data is now definitive:
| AI Implementation | Adoption Rate | Measured ROI | Payback Period |
|---|---|---|---|
| Product Recommendations | 35% of sites | 12–18% AOV lift | 2–4 months |
| AI Chatbots | 28% of sites | 20–30% support cost cut | 1–3 months |
| Generative Product Descriptions | 22% of merchants | 5–8% conversion lift | Immediate |
| Agentic Shopping Assistants | 8% of high-growth brands | 3–5x higher AOV per interaction | 4–6 months |
The wildcard is agentic shopping. Conversational AI that builds entire carts for users ("I want a gift for a techie under $100") is early-stage but delivering 3–5x higher AOV per interaction. Eight percent adoption today; 25–40% by end of 2027. Merchants deploying AI product recommendations early are building a compounding data advantage that will be hard to replicate.
The threshold for ROI: AI tools must pay for themselves within 6 months via measurable uplift. Most do. The merchants who fail with AI deploy without A/B testing or have unrealistic expectations of "passive" revenue lift. You need to measure, iterate, and optimize.
BNPL Is Contracting — But Installments Aren't Going Anywhere
Buy Now, Pay Later peaked in 2023. Affirm's 2026 forecast shows 15% contraction in US BNPL volume. Klarna is scaling down. The reason: merchants realized BNPL increases cart size but not profitability.
Here's the math nobody wants to do. A shopper spends $800 instead of $400 with BNPL. But 12–18% default rates mean chargebacks eat into that gain. After the BNPL provider takes 2–3% processing fee and customer support costs another $25–40 per disputed order, the net gain is roughly $290 on an $800 order. Still positive, but nowhere near the 2x ROI story from 2022.
The shift: merchants are consolidating to 1–2 BNPL providers and raising minimums. A BNPL option that paid for itself at $50 minimums now requires $150+ to maintain profitability.
One development worth watching: in-app installments (Apple Pay Later, Google Pay Later, PayPal installments) are growing faster than standalone BNPL startups. Friction is lower, defaults are lower, and integration is nearly invisible.
Retention Economics Are the New Acquisition
CAC inflation forced a reckoning. Google Ads CPC rose 24% in 2025 vs. 2024. Facebook CPM is up 31%. Email list growth has slowed. The math is brutal: a $50 CAC on a $100 AOV store means you lose money on the first purchase. You need 3+ purchases to break even.
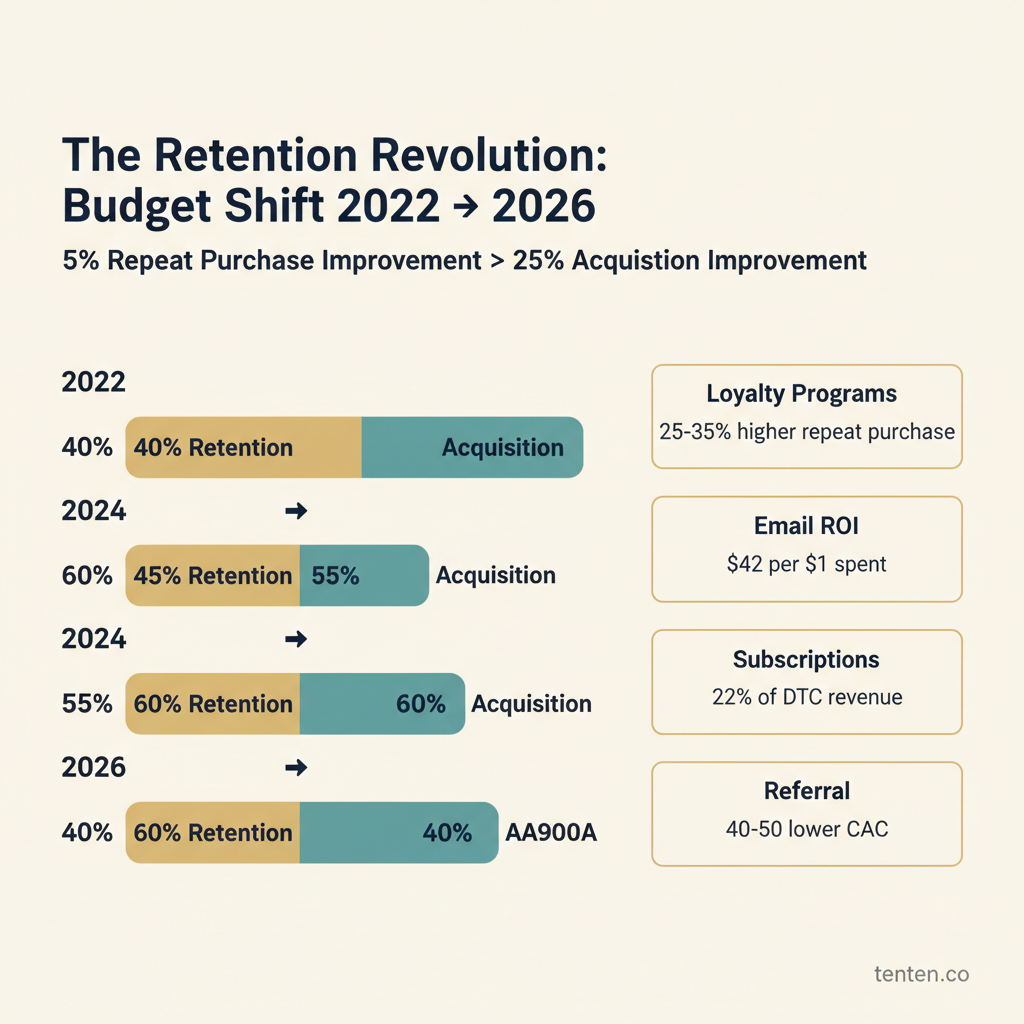
The data point that changed everything: Shopify's 2025 State of Commerce report showed that a 5% improvement in repeat purchase rate beats a 25% improvement in acquisition rate for total revenue growth. This flipped every budget allocation.
| Retention Tactic | 2026 Adoption | ROI Impact | Trend Direction |
|---|---|---|---|
| Loyalty Programs | 64% of brands (vs. 42% in 2023) | 25–35% higher repeat purchase | ↑ Accelerating |
| Subscription Models | 22% of DTC revenue (vs. 8% in 2023) | 3–5x higher margins vs. one-time | ↑ Accelerating |
| Email Marketing | Returning to dominance | $42 per $1 spent (vs. $5 social ads) | ↑ Strong resurgence |
| Referral Programs | 18% of new acquisition (vs. 10% in 2023) | 40–50% lower CAC than paid ads | ↑ Growing fast |
Smart merchants pivoted their budget allocation to 60% retention / 40% acquisition — up from 55/45 in 2024. The merchants still running 70% acquisition budgets are the ones reporting flat or declining growth. Tactics like reducing subscription churn are driving measurable LTV gains across the board.
Margins Are Tightening — And Winners Are Optimizing Ruthlessly
Gross margins for DTC brands compressed 3–5% in 2025. Supply chain costs are up 8–12%. Returns rates climbed from 15% to 18%. Discount dependence is rising. A brand doing $2M/year at 40% gross margin earns $800K. That same brand at 35% margin earns $700K — a 12.5% profit drop despite growing 10% on top-line revenue.
The winners improved operational margins, not top-line revenue. Here are the specific tactics working:
| Margin Tactic | Revenue Impact | Margin Impact | Implementation Effort |
|---|---|---|---|
| Unit Economics Audit (cut bottom 20% SKUs) | -5–8% revenue | +3–5% margin | 2–4 weeks |
| Bundling (low + high margin products) | +8–12% AOV | +2–3% blended margin | 1–2 weeks |
| Tiered Pricing (standard + premium) | +10–15% AOV | +4–6% on premium tier | 3–6 weeks |
| Dynamic Pricing (demand/segment-based) | +5–8% revenue | +2–4% margin | 6–12 weeks |
| True Shipping Costs (vs. flat-rate free) | -3% conversion | +1–2% margin | 1 week |
Merchants implementing 3+ of these tactics report 300–500 basis points of margin improvement. That's the difference between a profitable brand and one that's slowly bleeding.
Generative Search (GEO) Is Reshaping Product Discovery
ChatGPT Search, Perplexity, SearchGPT, and other AI-powered search engines captured 8–12% of search traffic in 2025. In 2026, estimate is 15–20%. One in five product discovery queries now happens in AI search engines, not Google.
Merchants adapting to GEO (Generative Engine Optimization) are reporting 8–15% organic traffic growth — vs. 0–2% for Google-only strategies. The playbook:
- Entity optimization: Ensure your brand, products, and company appear in knowledge graphs with clear definitions
- Quotable content: Write short, quotable paragraphs (80–150 words) that answer user intent directly — AI engines pull these as citations
- Structured data: Use schema markup so AI engines understand your products, prices, and reviews
- Original perspective: Write contrarian, data-backed analysis — generic content won't get cited
For a deeper dive on GEO strategy, read our complete Generative Engine Optimization playbook.
Headless Commerce Scales — But Only for Enterprise
Headless ecommerce (decoupled frontend from backend) grew 24% in 2025. Shopify Plus and BigCommerce Enterprise are winning the headless war. The appeal: merchants own the customer experience entirely.
But headless is only viable for brands doing $10M+ ARR (engineering investment is $200–500K), multi-channel merchants powering app + web + social + POS simultaneously, or brands with 100K+ monthly visitors needing performance optimization at scale.
For mid-market brands under $5M, headless is overkill. Shopify's native theme builder and Hydrogen framework are attractive but require 40–60 hours of custom development. ROI: 8–15% conversion lift + 20–30% faster page loads. If your conversion rate is already 2.5%+, headless ROI is clear. If it's below 1.5%, you have bigger problems to fix first — messaging, targeting, and product-market fit.
The trend to watch: Hydrogen is becoming the default for Shopify Plus new builds (30% of new Shopify Plus sites). It's no longer the experimental option — it's the standard.
B2B Ecommerce Explodes (But Looks Nothing Like B2C)
B2B ecommerce grew 32% in 2025, 2.8x faster than B2C. Digital procurement is finally winning against legacy EDI and manual ordering. Shopify Plus B2B (wholesale channel) saw 47% growth year-over-year.
| Metric | B2B Ecommerce | B2C Ecommerce |
|---|---|---|
| Sales Cycle | 60–120 days | 0–3 days |
| Average Order Value | $5K–$50K | $100–$300 |
| Revenue Growth (2025) | 32% YoY | 11.2% YoY |
| Margin Profile | 2–3x higher | Standard |
| Churn Profile | Low (high switching costs) | High (low switching costs) |
B2B is lower volume, higher margin, and highly profitable. A brand with $500K B2B revenue is often more valuable than $2M B2C revenue. The merchants winning in B2B built transparent pricing, offer self-serve ordering for repeat purchases, provide bulk/customization options, and integrate with customer procurement systems (EDI, API, cXML).
Privacy-First Marketing Replaces Surveillance
iOS privacy changes killed third-party cookie tracking. 2025 saw the death of reliable cross-domain attribution. Google's Privacy Sandbox delayed again — full deprecation is now 2026–2027.
Merchants adapted with first-party data collection (email capture everywhere), contextual targeting (ads based on webpage content, not user history), incrementality testing (matched-market holdout tests), and privacy labels that signal trust. Brands publishing transparent data-use policies are seeing 4–8% higher conversion.
The winners: merchants with 100K+ email lists. The losers: merchants entirely dependent on Facebook/Google retargeting pixels.
Frequently Asked Questions
What's the biggest change in ecommerce between 2024 and 2026?
Should I still invest in Google Ads if CPCs are rising?
Is Buy Now Pay Later (BNPL) dead?
What should my marketing budget split be in 2026?
Is Shopify Plus headless commerce worth it for my brand?
What AI tools should a Shopify merchant implement first?
How do I prepare for Generative Engine Optimization (GEO)?
The Merchant Playbook for 2026
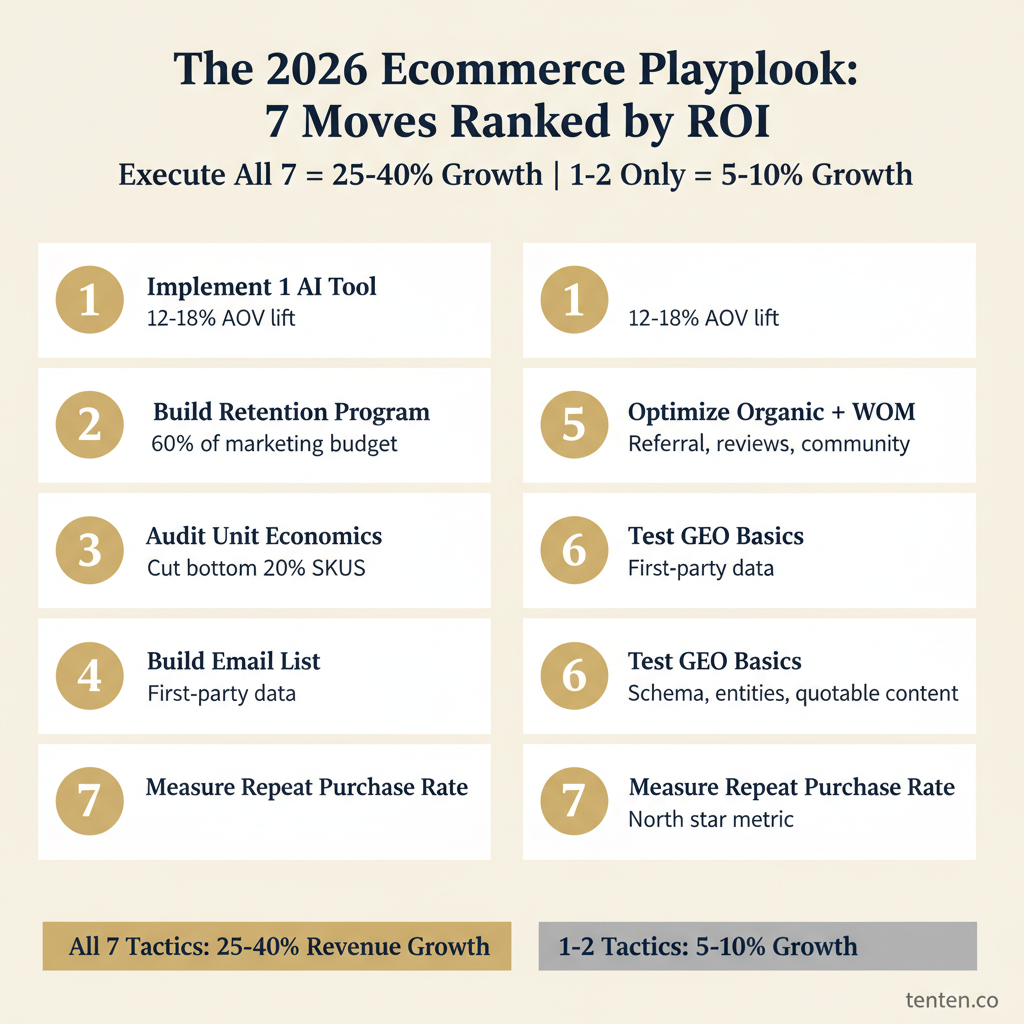
If you're a Shopify merchant making budget decisions this quarter, here's the priority stack — ranked by ROI per effort:
- Implement 1 AI tool (product recommendations or chatbot). Measure ROI. Don't boil the ocean with 5 tools at once.
- Build a retention program (loyalty or subscription). 60% of marketing effort goes here, not acquisition.
- Audit unit economics ruthlessly. Eliminate bottom 10–20% of SKUs by margin contribution.
- Start email list building with first-party data. Assume cookies disappear.
- Optimize for organic and word-of-mouth (referral, reviews, brand community).
- Test GEO basics — schema markup, entity optimization, quotable content for AI engines.
- Measure repeat purchase rate obsessively. It's your north star metric.
The merchants executing all 7 are reporting 25–40% revenue growth despite slower market conditions. The merchants doing 1–2 are growing 5–10%.
What's Coming in 2026–2027
Looking ahead, five forces will reshape the next 18 months:
- AI shopping agents move from novelty to standard — expect 25–40% of transactions to be agent-assisted
- Subscription penetration rises to 35% of DTC revenue (vs. 22% today)
- Localization becomes table stakes — regional pricing, payment methods, and language customization
- Real-time inventory sync across all channels is expected (DTC, marketplace, wholesale, physical retail)
- Privacy regulations tighten further (EU, California, and additional states enacting strict data laws)
The merchants who started moving in these directions in 2025 have a 12–18 month head start. The smart move is to start now.
Ready to position your Shopify store for 2026 growth? Get a strategic consultation from Tenten's ecommerce analysts. We analyze your current positioning, identify opportunities in retention and margin optimization, and build a 2026 playbook tailored to your business.