Admin API vs GraphQL Storefront Comparison
| Use Case | Admin API | Storefront API | Recommendation |
|---|---|---|---|
| Custom inventory dashboard | ✓ Full read/write | ✗ No | Admin API |
| Headless storefront | ✗ Server-only | ✓ Client or server | Storefront API |
| Order management system | ✓ Full CRUD | ✗ No | Admin API |
| Product catalog display | ✓ Works | ✓ Optimized | Storefront API |
| Analytics & reporting | ✓ Most data | ✗ Limited | Admin API |
| Real-time price updates | ✓ Can do | ✓ Faster | Storefront API + caching |
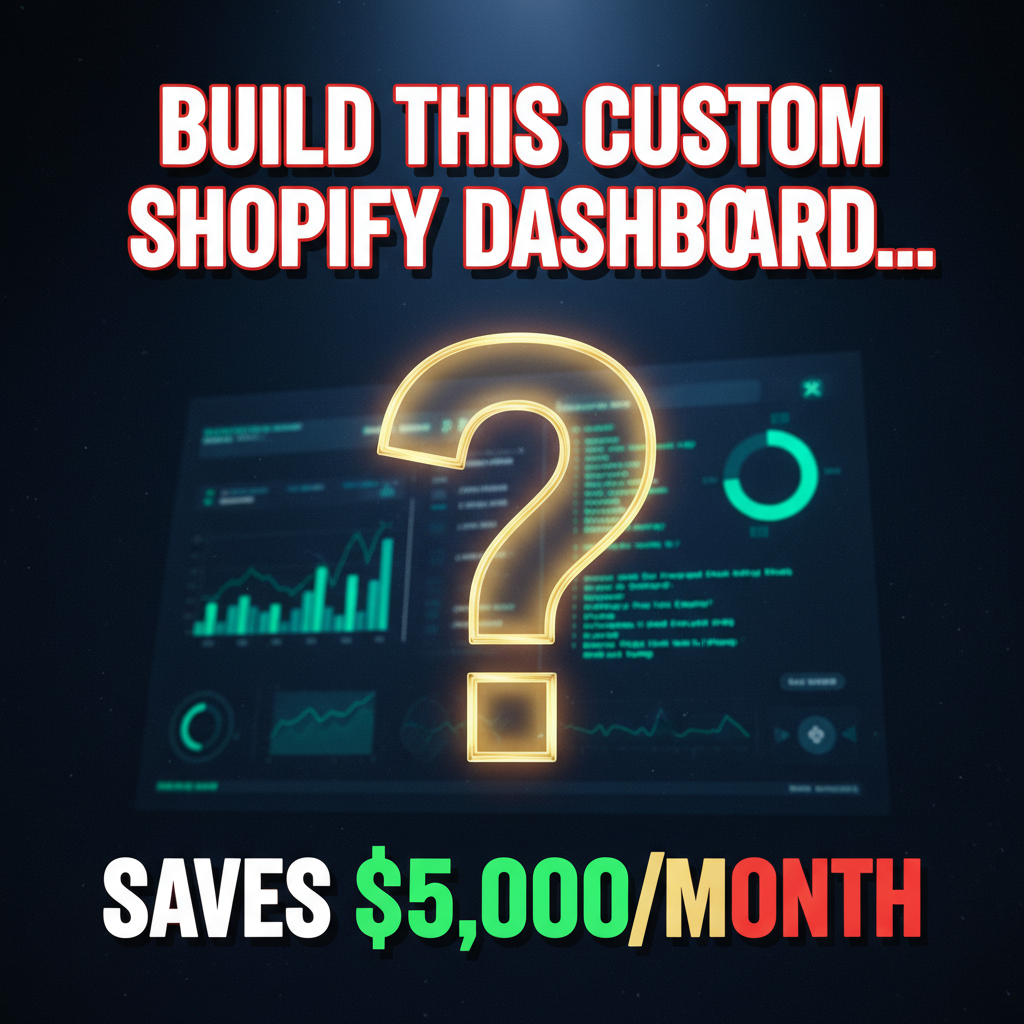
Why Build a Custom Shopify Dashboard
Shopify's native admin dashboard is feature-rich. But it's not designed for specific workflows. If you manage inventory across 5 warehouses, Shopify admin doesn't show you warehouse-level analytics. If you need custom reporting on customer LTV or cohort retention, you're stuck with native reports or third-party tools.
Custom dashboards solve this. They're built for your specific business logic.
A $5M Shopify Plus store that built a custom dashboard saw:
- 40% faster order fulfillment (warehouse managers see real-time orders in their dashboard, not Shopify admin)
- 30% fewer inventory mistakes (custom dashboard flags low stock across warehouses automatically)
- 25% improvement in staff utilization (dashboard automates labor allocation decisions)
The investment: 200-400 developer hours. ROI: Positive within 6 months.
Architecture: Admin API + React Frontend
A custom Shopify dashboard has three layers:
Layer 1: Admin API (Backend)
Shopify's GraphQL Admin API is the data backbone. It exposes:
- Orders, products, inventory, fulfillment
- Customers, customer segments, customer journey
- Analytics (revenue, orders, traffic by source)
- Financial reports (payments, fees, settlements)
Authentication: OAuth 2.0 with a private app (for staff) or public app (for merchants).
Layer 2: Backend Server (Optional)
For simple dashboards, query the Admin API directly from React. For complex dashboards, add a Node.js/Python backend to:
- Cache frequently-accessed data (reduce API calls)
- Aggregate data across multiple Shopify calls (e.g., orders + customer data in one response)
- Enforce permission control (only managers see financial reports)
- Batch webhook processing (listen for order changes, update dashboard in real-time)
Layer 3: React Frontend
A React single-page app displays dashboard UI. Libraries:
- Polaris: Shopify's design system, pre-built components for Shopify dashboards
- Recharts or Chart.js: Charting and visualization
- TanStack Query: Caching and syncing data fetches
- Zustand or Jotai: State management
Step 1: Set Up Admin API Access
Create a private app in Shopify admin (Settings > Apps and Integrations > App and Integration Settings > Develop Apps):
- Click "Create an app"
- Name it: "Custom Dashboard"
- Select "Admin API" scope
- Request scopes:
read_orders,read_products,read_inventory,read_customers,read_analytics - Generate credentials (API key + access token)
Store credentials in .env:
SHOPIFY_STORE_URL=yourstore.myshopify.com
SHOPIFY_ADMIN_API_KEY=...
SHOPIFY_ADMIN_ACCESS_TOKEN=...
Step 2: Create Backend Server (Node.js)
Set up Express.js with Shopify GraphQL client:
npm install express shopify-app-express dotenv @apollo/client graphql
Create server.js:
import express from "express"; import { createClient } from "graphql-request"; import dotenv from "dotenv";dotenv.config();
const app = express();
// Initialize Shopify GraphQL client
const client = createClient({
url:https://${process.env.SHOPIFY_STORE_URL}/admin/api/2024-01/graphql.json,
headers: {
"X-Shopify-Access-Token": process.env.SHOPIFY_ADMIN_ACCESS_TOKEN
}
});// API route: Fetch orders summary
app.get("/api/orders-summary", async (req, res) => {
const query =query { orders(first: 100) { edges { node { id name createdAt totalPriceSet { shopMoney { amount } } fulfillmentStatus } } } };try {
const data = await client.request(query);
res.json(data.orders.edges);
} catch (error) {
res.status(500).json({ error: error.message });
}
});// API route: Fetch inventory
app.get("/api/inventory", async (req, res) => {
const query =query { inventoryLevels(first: 50) { edges { node { id quantities(names: ["available"]) { name quantity } location { name } } } } };try {
const data = await client.request(query);
res.json(data.inventoryLevels.edges);
} catch (error) {
res.status(500).json({ error: error.message });
}
});
app.listen(3001, () => console.log("Server running on :3001"));
Step 3: Build React Frontend
Create a React app with Vite:
npm create vite@latest dashboard -- --template react
cd dashboard
npm install @shopify/polaris recharts @tanstack/react-query axios
Create src/App.jsx:
import React, { useState, useEffect } from "react"; import { Page, Layout, Card, VerticalStack } from "@shopify/polaris"; import { LineChart, Line, XAxis, YAxis, CartesianGrid, Tooltip } from "recharts"; import { useQuery } from "@tanstack/react-query";const apiClient = axios.create({
baseURL: "http://localhost:3001/api"
});export default function Dashboard() {
// Fetch orders summary
const { data: orders, isLoading: ordersLoading } = useQuery({
queryKey: ["orders"],
queryFn: async () => {
const res = await apiClient.get("/orders-summary");
return res.data;
},
refetchInterval: 60000 // Refetch every 60 seconds
});// Fetch inventory
const { data: inventory } = useQuery({
queryKey: ["inventory"],
queryFn: async () => {
const res = await apiClient.get("/inventory");
return res.data;
}
});return (
<Page title="Custom Dashboard">
<Layout>
<Layout.Section>
<Card>
<VerticalStack gap="5">
<h2>Orders Today</h2>
{ordersLoading ? (
<p>Loading...</p>
) : (
<p>{orders?.length || 0} orders</p>
)}
</VerticalStack>
</Card>
</Layout.Section><Layout.Section> <Card> <VerticalStack gap="5"> <h2>Inventory by Location</h2> {inventory?.map((inv) => ( <div key={inv.node.id}> <p> {inv.node.location.name}:{" "} {inv.node.quantities[0].quantity} units </p> </div> ))} </VerticalStack> </Card> </Layout.Section> </Layout> </Page>
);
}
Step 4: Add Real-Time Updates with Webhooks
Listen for Shopify events (order created, inventory changed) and push updates to dashboard via WebSocket.
Set up webhook receiver in server.js:
app.post("/webhooks/orders/create", (req, res) => { const order = req.body;// Broadcast to all connected WebSocket clients
wss.clients.forEach(client => {
if (client.readyState === WebSocket.OPEN) {
client.send(JSON.stringify({
type: "ORDER_CREATED",
order: order
}));
}
});
res.status(200).send("OK");
});
In React, listen to WebSocket:
useEffect(() => { const ws = new WebSocket("ws://localhost:3001");ws.onmessage = (event) => {
const message = JSON.parse(event.data);
if (message.type === "ORDER_CREATED") {
// Update dashboard in real-time
queryClient.invalidateQueries({ queryKey: ["orders"] });
}
};
return () => ws.close();
}, []);
Real-World Example: A $8M Shopify Plus Apparel Store
Threads & Co. sells premium apparel, $8M annual revenue, 3 warehouses, 250 SKUs. Shopify admin didn't show warehouse-level inventory or fulfillment speed.
Custom Dashboard Features:
- Warehouse View: Each warehouse sees its orders, inventory, and fulfillment queue
- KPI Dashboard: Real-time orders, revenue, average fulfillment time
- Inventory Forecast: Predicts stock-outs 7 days ahead (based on sales velocity)
- Staff Performance: Each warehouse manager sees their fulfillment speed vs. team average
Implementation:
- Backend: Node.js + Shopify Admin API (300 lines)
- Frontend: React + Polaris (500 lines)
- WebSocket for real-time order updates
- Deployment: Vercel (frontend) + AWS EC2 (backend)
Results:
- Fulfillment time dropped from 2.1 days to 1.3 days
- Inventory accuracy improved 28% (staff respond faster to low stock)
- Warehouse utilization increased 18% (dashboard shows bottlenecks)
- Development cost: $15K (outsourced developer), ROI: Positive within 4 months
Common Mistakes
Mistake 1: Over-Fetching Data
Don't fetch all orders and products on page load. Use pagination and filters:
query {
  orders(first: 50, query: "status:unfulfilled") {
    # Only unfulfilled orders, limit 50
  }
}
Mistake 2: Not Caching
Every API call costs latency and Shopify API rate limits. Implement caching:
// Cache orders for 5 minutes
const cachedOrders = cache.get("orders");
if (cachedOrders && Date.now() - cachedOrders.time < 300000) {
  return cachedOrders.data;
}
Mistake 3: Ignoring Rate Limits
Shopify Admin API has rate limits (2 calls/second for standard plans). Batch requests and implement exponential backoff:
async function fetchWithRetry(query, retries = 3) {
  try {
    return await client.request(query);
  } catch (error) {
    if (error.message.includes("Rate limited") && retries > 0) {
      await new Promise(r => setTimeout(r, 1000 * (4 - retries)));
      return fetchWithRetry(query, retries - 1);
    }
    throw error;
  }
}
Performance Tips
Data Fetching:
- Use GraphQL aliases to batch multiple queries into one request
- Implement pagination (fetch 50 items at a time, not 1,000)
- Cache frequently-accessed data (KPIs, inventory) server-side
Frontend:
- Lazy-load components (don't render all charts on page load)
- Implement infinite scroll for large data lists
- Use React Query for automatic cache invalidation
Infrastructure:
- Deploy backend close to Shopify (AWS us-east-1 region)
- Use CDN for frontend assets (Vercel, Netlify handle this automatically)
Ready to Build Your Custom Dashboard?
Custom Shopify dashboards solve workflows that off-the-shelf tools can't. Stop copying data into spreadsheets. Build a real-time operations dashboard.
Contact tenten.co/contact to architect your custom dashboard.
Explore more Shopify API development techniques to ensure your dashboard is secure and performant.
Editorial Note: Custom dashboards are the hidden productivity leverage in scaling Shopify operations. Teams that invest 200 hours in custom dashboards save 1,000+ hours annually in manual data work.
Frequently Asked Questions
Should I use Shopify's native dashboard or build custom?
Use native for standard reporting (revenue, orders by source). Build custom if you have workflow-specific needs (warehouse management, custom metrics, multi-location coordination, or complex automation).
How do I keep my dashboard real-time without hammering the API?
Use webhooks for high-frequency events (order creation, inventory changes). Update dashboard immediately on webhook, refresh summary data every 60 seconds via API. This balances freshness and rate limits.
What's the development cost for a custom dashboard?
Simple dashboard (3-4 pages, basic charts): 100-150 hours ($10K-15K outsourced). Mid-complexity (warehouse management, KPI tracking, 8-10 pages): 250-350 hours ($20K-30K). Enterprise (multi-location, real-time sync, complex logic): 500+ hours ($40K-60K).
Can I use Shopify's built-in dashboard customization instead of building custom?
Shopify's dashboard customization (custom cards, metrics) is limited. It's sufficient for simple KPI monitoring but can't handle workflow-specific needs (warehouse routing, custom inventory logic). Custom React dashboards offer unlimited flexibility.
How often should my dashboard refresh data?
Real-time critical data (orders, fulfillment status): 30-60 second refresh. Summary metrics (daily revenue, KPIs): 5-10 minute refresh. Historical data (trends, monthly reports): hourly refresh. Use webhooks for event-driven updates on critical data.